Jack Beckwith (W '16), Nick Sorscher (C '16) and Aziz Kamoun (C '16) describe themselves as “data junkies who like to investigate topics in music, politics and sports.” Their tech startup, The DataFace, publishes data analysis stories with data–based visuals on various topics.
“It boils down to: What are we interested in?” said Jack. “What do we think we can get data about? And how rigorously can we use the data to test our hypothesis?”
The site started as Jack’s personal blog during his senior year at Penn. Now he, Nick and Aziz still work almost entirely with data that is readily available online. Many social media sites, such as Facebook and Twitter, have an Application Programming Interface (API), which allow anyone with rudimentary coding experience to access a snapshot of data from those sites. And so, on Sunday, during the Presidential Debate, the three team members analyzed Twitter’s API to write a story testing the hypothesis developed beforehand that Twitter will react negatively to Trump during the debate in light of the recent tax return and sexual abuse scandals while Clinton will fare more positively. The DataFace analyzed a large sample of tweets about both Clinton and Trump and determine the positivity or negativity of the tweet using a computer algorithm.
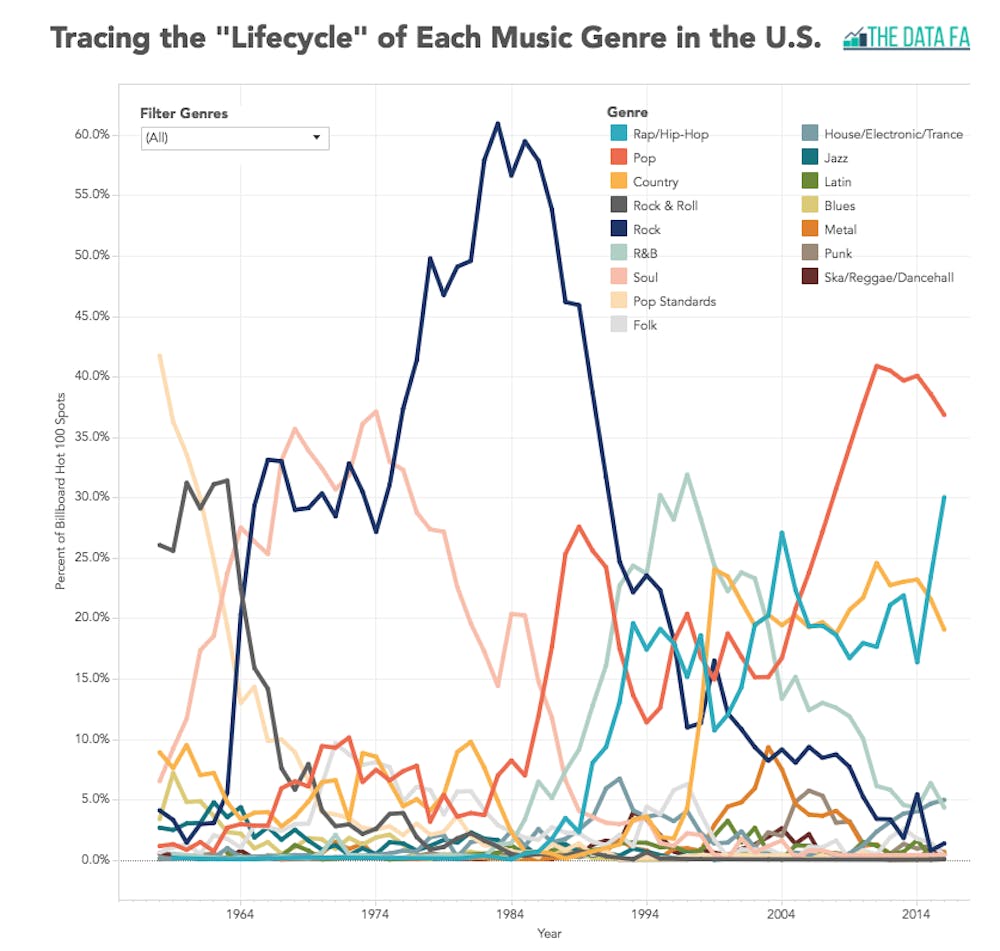
Other stories on The DataFace include “Are the 2015–16 Warriors the Best NBA Team Ever?” “Mapping the Hometowns of Billboard Hot 100 Artists” and “Determining the “Lifecycle” of Each Music Genre.” One story was even picked up by The Washington Post: “Trump and the Media: a Text Analysis.” Each article employs interactive visual representations of the data collected as well as explanations for how and from what source. It is, essentially, statistics for people who hate math and journalism for people who love it.
“There is so much data out there and a lot of places are making their data more readily available than people realize,” said Jack. He hopes that, in the future, The DataFace will work with major brands with a need for data analytics or custom data visualizations.